
In Stock - same-working day dispatch
Couldn't load pickup availability
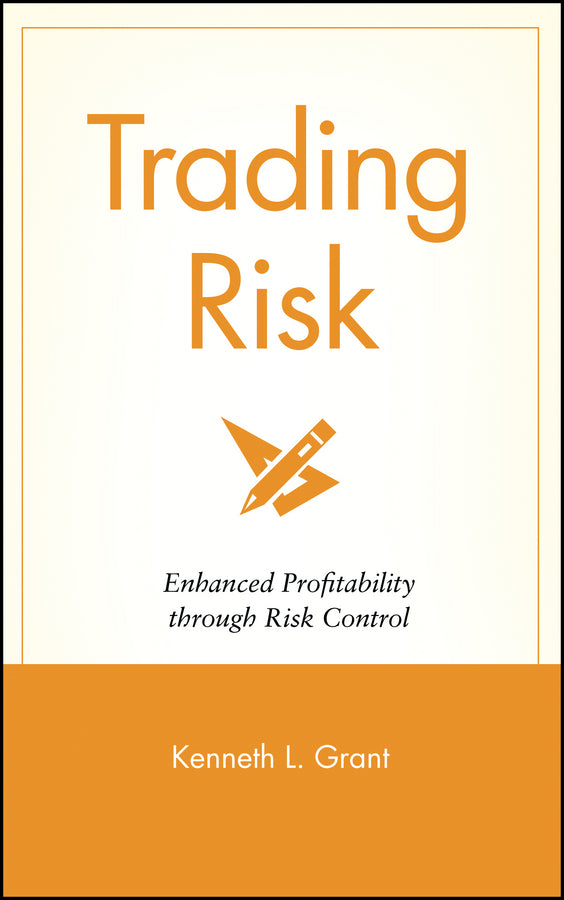
Trading Risk
Enhanced Profitability through Risk Control
Kenneth L. Grant (Author)
9780471650911, Wiley
Hardback, published 5 October 2004
272 pages
23.8 x 16.4 x 2.2 cm, 0.517 kg
Revolutionary techniques that traders can implement to improve profits and avoid losses No trader, professional or individual, can afford not to have a solid risk management program integrated into his or her trading system. But finding a precise mathematical model to replace subjective decision-making processes is a challenge. Traditionally, risk management has focused solely on loss avoidance, but in Trading Risk, hedge fund risk manager Kenneth Grant presents some-thing completely new—how to manage a portfolio to minimize risk and increase profits by putting more capital at risk. Trading Risk details a risk management program that can help both money managers and individual traders evaluate which elements in a portfolio are working efficiently and which aren’t. By illustrating an extremely simple set of statistical and arithmetic tools this book can help readers enhance their performance in many financial markets. Kenneth L.Grant is Cheyne’s Global Risk Manager, and is the Managing Member for Cheyne Capital, LLC, the firm’s U.S. arm. Mr. Grant is a pioneer in the field of hedge fund risk management and capital allocation. Before joining Cheyne, he created risk control programs at two of the world’s leading hedge funds, Tudor Investments and SAC Capital, where he was eventually promoted to the title of Chief Investment Strategist. Mr. Grant holds a Bachelor of Science in Economics and Mathematics from the University of Wisconsin, an MA in Economics from Columbia University, and an MBA from the University of Chicago Graduate School of Business.
Preface ix Acknowledgments xiv Chapter 1 The Risk Management Investment 1 Chapter 2 Setting Performance Objectives 19 Optimal Target Return 21 Nominal Target Return 24 Stop-Out Level 26 The Beach 32 Chapter 3 Understanding the Profit/Loss Patterns over Time 37 And Now to Statistics, but First a Word (or More) about Time Series Construction 39 Time Units 40 Time Spans 43 Graphical Representation of Daily P/L 48 Histogram of P/L Observations 51 Statistics 53 A Tribute to Sir Isaac Newton 53 Average P/L 56 Standard Deviation 57 Sharpe Ratio 65 Median P/L 68 Percentage of Winning Days 68 Performance Ratio, Average P/L, Winning Days versus Losing Days 69 Drawdown 70 Correlations 73 Putting It All Together 79 Chapter 4 The Risk Components of an Individual Portfolio 81 Historical Volatility 84 Options Implied Volatility 86 Correlation 90 Value at Risk (VaR) 91 Justification for VaR Calculations 92 Types of VaR Calculations 94 Testing VaR Accuracy 98 Setting VaR Parameters 99 Use of VaR Calculation in Portfolio Management 102 Scenario Analysis 104 Technical Analysis 106 Chapter 5 Setting Appropriate Exposure Levels (Rule 1) 109 Determining the Appropriate Ranges of Exposure 110 Method 1: Inverted Sharpe Ratio 111 Method 2: Managing Volatility as a Percentage of Trading Capital 114 Drawdowns and Netting Risk 129 Asymmetric Payoff Function 130 Chapter 6 Adjusting Portfolio Exposure (Rule 2) 133 Size of Individual Positions 134 Directional Bias 135 Position Level Volatility 141 Time Horizon 142 Diversification 144 Leverage 146 Optionality 148 Nonlinear Pricing Dynamics 149 Relationship between Strike Price and Underlying Price (Moneyness) 149 Implied Volatility 150 Asymmetric Payoff Functions 150 Leverage Characteristics 151 Summary 154 Chapter 7 The Risk Components of an Individual Trade 155 Your Transaction Performance 156 Key Components of a Transactions-Level Database 157 Defining a Transaction 158 Position Snapshot Statistics 160 Core Transactions-Level Statistics 161 Trade Level P/L 162 Holding Period 162 Average P/L 163 P/L per Dollar Invested (Weighted Average P/L) 164 Average Holding Period 164 P/L by Security (P/L Attribution) 165 Long Side P/L versus Short Side P/L 166 Correlation Analysis 168 Number of Daily Transactions 170 Capital Invested 171 Net Market Value (Raw) 172 Net Market Value (Absolute Value) 173 Number of Positions 174 Holding Periods 175 Volatility/VaR 177 Other Correlations 179 Final Word on Correlation 179 Performance Success Metrics 184 Methods for Improving Performance Ratios 189 Performance Ratio Components 190 Maximizing Your P/L 192 Profitability Concentration (90/10) Ratio 200 Putting It All Together 208 Chapter 8 Bringin’ It on Home 213 Make a Plan and Stick to It 214 If the Plan’s Not Working, Change the Plan 218 Seek to Trade with an “Edge” 219 Structural Inefficiencies 220 Methodological Inefficiencies 223 Play Your P/L 226 Avoid Surprises—Especially to Yourself 234 Seek to Maximize Your Performance at the Margin 236 Seek Nonmonetary Benefits 237 Apply Liberal Doses of Humility and Humor 242 Be Healthy/Cultivate Other Interests 244 Appendix Optimal f and Risk of Ruin 245 Optimal f 246 Risk of Ruin 250 Index 253
Subject Areas: Finance & accounting [KF]