
Freshly Printed - allow 7 days lead
Couldn't load pickup availability
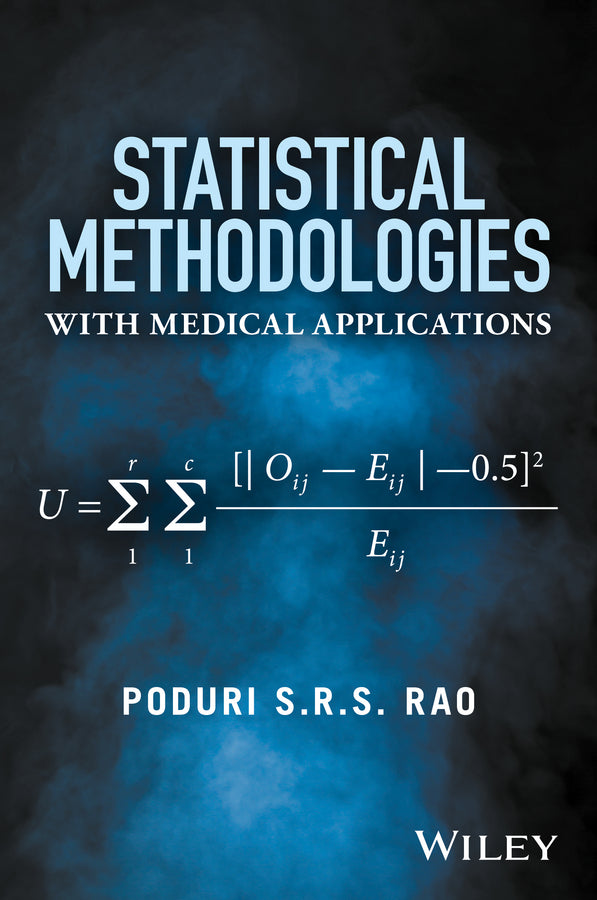
Statistical Methodologies with Medical Applications
Poduri S.R.S. Rao (Author)
9781119258490, Wiley
Hardback, published 9 December 2016
288 pages
22.9 x 15.5 x 2 cm, 0.476 kg
This book presents the methodology and applications of a range of important topics in statistics, and is designed for graduate students in Statistics and Biostatistics and for medical researchers. Illustrations and more than ninety exercises with solutions are presented. They are constructed from the research findings of the medical journals, summary reports of the Centre for Disease Control (CDC) and the World Health Organization (WHO), and practical situations. The illustrations and exercises are related to topics such as immunization, obesity, hypertension, lipid levels, diet and exercise, harmful effects of smoking and air pollution, and the benefits of gluten free diet.
This book can be recommended for a one or two semester graduate level course for students studying Statistics, Biostatistics, Epidemiology and Health Sciences. It will also be useful as a companion for medical researchers and research oriented physicians.
Topics for illustrations, examples and exercises xv Preface xvii List of abbreviations xix 1 Statistical measures 1 1.1 Introduction 1 1.2 Mean, mode and median 2 1.3 Variance and standard deviation 3 1.4 Quartiles, deciles and percentiles 4 1.5 Skewness and kurtosis 5 1.6 Frequency distributions 6 1.7 Covariance and correlation 7 1.8 Joint frequency distribution 9 1.9 Linear transformation of the observations 10 1.10 Linear combinations of two sets of observations 10 Exercises 11 2 Probability, random variable, expected value and variance 14 2.1 Introduction 14 2.2 Events and probabilities 14 2.3 Mutually exclusive events 15 2.4 Independent and dependent events 15 2.5 Addition of probabilities 16 2.6 Bayes’ theorem 16 2.7 Random variables and probability distributions 17 2.8 Expected value, variance and standard deviation 17 2.9 Moments of a distribution 18 Exercises 18 3 Odds ratios, relative risk, sensitivity, specificity and the ROC curve 19 3.1 Introduction 19 3.2 Odds ratio 19 3.3 Relative risk 20 3.4 Sensitivity and specificity 21 3.5 The receiver operating characteristic (ROC) curve 22 Exercises 22 4 Probability distributions, expectations, variances and correlation 24 4.1 Introduction 24 4.2 Probability distribution of a discrete random variable 25 4.3 Discrete distributions 25 4.3.1 Uniform distribution 25 4.3.2 Binomial distribution 26 4.3.3 Multinomial distribution 27 4.3.4 Poisson distribution 27 4.3.5 Hypergeometric distribution 28 4.4 Continuous distributions 29 4.4.1 Uniform distribution of a continuous variable 29 4.4.2 Normal distribution 29 4.4.3 Normal approximation to the binomial distribution 30 4.4.4 Gamma distribution 31 4.4.5 Exponential distribution 32 4.4.6 Chisquare distribution 33 4.4.7 Weibull distribution 34 4.4.8 Student’s t, and F distributions 34 4.5 Joint distribution of two discrete random variables 34 4.5.1 Conditional distributions, means and variances 35 4.5.2 Unconditional expectations and variances 36 4.6 Bivariate normal distribution 37 Exercises 38 Appendix A4 38 A4.1 Expected values and standard deviations of the distributions 38 A4.2 Covariance and Correlation of the Numbers of Successes X and Failures (n – X) of the Binomial Random Variable 39 5 Means, standard errors and confidence limits 40 5.1 Introduction 40 5.2 Expectation, variance and standard error (S.E.) of the sample mean 41 5.3 Estimation of the variance and standard error 42 5.4 Confidence limits for the mean 43 5.5 Estimator and confidence limits for the difference of two means 44 5.6 Approximate confidence limits for the difference of two means 46 5.6.1 Large samples 46 5.6.2 Welch-Aspin approximation (1949, 1956) 46 5.6.3 Cochran’s approximation (1964) 46 5.7 Matched samples and paired comparisons 47 5.8 Confidence limits for the variance 48 5.9 Confidence limits for the ratio of two variances 49 5.10 Least squares and maximum likelihood methods of estimation 49 Exercises 51 Appendix A5 52 A5.1 Tschebycheff’s inequality 52 A5.2 Mean square error 53 6 Proportions, odds ratios and relative risks: Estimation and confidence limits 54 6.1 Introduction 54 6.2 A single proportion 54 6.3 Confidence limits for the proportion 55 6.4 Difference of two proportions or percentages 56 6.5 Combining proportions from independent samples 56 6.6 More than two classes or categories 57 6.7 Odds ratio 58 6.8 Relative risk 59 Exercises 59 Appendix A6 60 A6. 1 Approximation to the variance of lnp 1 60 7 Tests of hypotheses: Means and variances 62 7.1 Introduction 62 7.2 Principle steps for the tests of a hypothesis 63 7.2.1 Null and alternate hypotheses 63 7.2.2 Decision rule, test statistic and the Type I & II errors 63 7.2.3 Significance level and critical region 64 7.2.4 The p-value 64 7.2.5 Power of the test and the sample size 65 7.3 Right-sided alternative, test statistic and critical region 65 7.3.1 The p-value 66 7.3.2 Power of the test 66 7.3.3 Sample size required for specified power 67 7.3.4 Right-sided alternative and estimated variance 68 7.3.5 Power of the test with estimated variance 69 7.4 Left-sided alternative and the critical region 69 7.4.1 The p-value 70 7.4.2 Power of the test 70 7.4.3 Sample size for specified power 71 7.4.4 Left-sided alternative with estimated variance 71 7.5 Two-sided alternative, critical region and the p-value 72 7.5.1 Power of the test 73 7.5.2 Sample size for specified power 74 7.5.3 Two-sided alternative and estimated variance 74 7.6 Difference between two means: Variances known 75 7.6.1 Difference between two means: Variances estimated 76 7.7 Matched samples and paired comparison 77 7.8 Test for the variance 77 7.9 Test for the equality of two variances 78 7.10 Homogeneity of variances 79 Exercises 80 8 Tests of hypotheses: Proportions and percentages 82 8.1 A single proportion 82 8.2 Right-sided alternative 82 8.2.1 Critical region 83 8.2.2 The p-value 84 8.2.3 Power of the test 84 8.2.4 Sample size for specified power 84 8.3 Left-sided alternative 85 8.3.1 Critical region 85 8.3.2 The p-value 86 8.3.3 Power of the test 86 8.3.4 Sample size for specified power 86 8.4 Two-sided alternative 87 8.4.1 Critical region 87 8.4.2 The p-value 88 8.4.3 Power of the test 88 8.4.4 Sample size for specified power 89 8.5 Difference of two proportions 90 8.5.1 Right-sided alternative: Critical region and p-value 90 8.5.2 Right-sided alternative: Power and sample size 91 8.5.3 Left-sided alternative: Critical region and p-value 92 8.5.4 Left-sided alternative: Power and sample size 93 8.5.5 Two-sided alternative: Critical region and p-value 93 8.5.6 Power and sample size 94 8.6 Specified difference of two proportions 95 8.7 Equality of two or more proportions 95 8.8 A common proportion 96 Exercises 97 9 The Chisquare statistic 99 9.1 Introduction 99 9.2 The test statistic 99 9.2.1 A single proportion 100 9.2.2 Specified proportions 100 9.3 Test of goodness of fit 101 9.4 Test of Independence: (r X C) Classification 101 9.5 Test of independence: (2x2) classification 104 9.5.1 Fisher’s exact test of independence 105 9.5.2 Mantel-Hanszeltest statistic 106 Exercises 107 Appendix A9 109 A9.1 Derivations of 9.4(a) 109 A9.2 Equality of the proportions 109 10 Regression and correlation 110 10.1 Introduction 110 10.2 The regression model: One independent variable 110 10.2.1 Least squares estimation of the regression 112 10.2.2 Properties of the estimators 113 10.2.3 ANOVA (Analysis of Variance) for the significance of the regression 114 10.2.4 Tests of hypotheses, confidence limits and prediction intervals 116 10.3 Regression on two independent variables 118 10.3.1 Properties of the estimators 120 10.3.2 ANOVA for the significance of the regression 121 10.3.3 Tests of hypotheses, confidence limits and prediction intervals 122 10.4 Multiple regression: The least squares estimation 124 10.4.1 ANOVA for the significance of the regression 126 10.4.2 Tests of hypotheses, confidence limits and prediction intervals 127 10.4.3 Multiple correlation, adjusted R 2 and partial correlation 128 10.4.4 Effect of including two or more independent variables and the partial F-test 129 10.4.5 Equality of two or more series of regressions 130 10.5 Indicator variables 132 10.5.1 Separate regressions 132 10.5.2 Regressions with equal slopes 133 10.5.3 Regressions with the same intercepts 134 10.6 Regression through the origin 135 10.7 Estimation of trends 136 10.8 Logistic regression and the odds ratio 138 10.8.1 A single continuous predictor 139 10.8.2 Two continuous predictors 139 10.8.3 A single dichotomous predictor 140 10.9 Weighted Least Squares (WLS) estimator 141 10.10 Correlation 142 10.10.1 Test of the hypothesis that two random variables are uncorrelated 143 10.10.2 Test of the hypothesis that the correlation coefficient takes a specified value 143 10.10.3 Confidence limits for the correlation coefficient 144 10.11 Further topics in regression 144 10.11.1 Linearity of the regression model and the lack of fit test 144 10.11.2 the Assumption That V (ε I Xi)= σ2 , Same at Each Xi 146 10.11.3 Missing observations 146 10.11.4 Transformation of the regression model 147 10.11.5 Errors of Measurements of (Xi , Yi) 147 Exercises 148 Appendix A10 149 A0.1 Square of the Correlation of Yi and Ŷi 149 A10.2 Multiple regression 149 A10.3 Expression for SSR in (10.38) 151 11 Analysis of variance and covariance: Designs of experiments 152 11.1 Introduction 152 11.2 One-way classification: Balanced design 153 11.3 One-way random effects model: Balanced design 155 11.4 Inference for the variance components and the mean 155 11.5 One-way classification: Unbalanced design and fixed effects 157 11.6 Unbalanced one-way classification: Random effects 159 11.7 Intraclass correlation 160 11.8 Analysis of covariance: The balanced design 161 11.8.1 The model and least squares estimation 161 11.8.2 Tests of hypotheses for the slope coefficient and equality of the means 163 11.8.3 Confidence limits for the adjusted means and their differences 164 11.9 Analysis of covariance: Unbalanced design 165 11.9.1 Confidence limits for the adjusted means and the differences of the treatment effects 167 11.10 Randomized blocks 168 11.10.1 Randomized blocks: Random and mixed effects models 170 11.11 Repeated measures design 170 11.12 Latin squares 172 11.12.1 The model and analysis 172 11.13 Cross-over design 174 11.14 Two-way cross-classification 175 11.14.1 Additive model: Balanced design 176 11.14.2 Two-way cross-classification with interaction: Balanced design 178 11.14.3 Two-way cross-classification: Unbalanced additive model 179 11.14.4 Unbalanced cross-classification with interaction 183 11.14.5 Multiplicative interaction and Tukey’s test for nonadditivity 184 11.15 Missing observations in the designs of experiments 184 Exercises 186 Appendix A11 189 A11.1 Variance of σα 2 in (11.25) from Rao (1997, p. 20) 189 A11.2 The total sum of squares (Txx , Tyy) and sum of products (Txy) can be expressed as the within and between components as follows 189 12 Meta-analysis 190 12.1 Introduction 190 12.2 Illustrations of large-scale studies 190 12.3 Fixed effects model for combining the estimates 191 12.4 Random effects model for combining the estimates 193 12.5 Alternative estimators for σ 2 α 194 12.6 Tests of hypotheses and confidence limits for the variance components 194 Exercises 195 Appendix A12 196 13 Survival analysis 197 13.1 Introduction 197 13.2 Survival and hazard functions 198 13.3 Kaplan-Meir product-limit estimator 198 13.4 Standard error of Ŝ(tm) and confidence limits for S(tm) 199 13.5 Confidence limits for S(tm) with the right-censored observations 199 13.6 Log-Rank test for the equality of two survival distributions 201 13.7 Cox’s proportional hazard model 202 Exercises 203 Appendix A13 Expected value and variance of Ŝ(tm) and confidence limits for S(tm) 203 14 Nonparametric statistics 205 14.1 Introduction 205 14.2 Spearman’s rank correlation coefficient 205 14.3 The Sign test 206 14.4 Wilcoxon (1945) Matched-pairs Signed-ranks test 208 14.5 Wilcoxon’s test for the equality of the distributions of two non-normal populations with unpaired sample observations 209 14.5.1 Unequal sample sizes 210 14.6 McNemer’s (1955) matched pair test for two proportions 210 14.7 Cochran’s (1950) Q-test for the difference of three or more matched proportions 211 14.8 Kruskal-Wallis one-way ANOVA test by ranks 212 Exercises 213 15 Further topics 215 15.1 Introduction 215 15.2 Bonferroni inequality and the Joint Confidence Region 215 15.3 Least significant difference (LSD) for a pair of treatment effects 217 15.4 Tukey’s studentized range test 217 15.5 Scheffe’s simultaneous confidence intervals 218 15.6 Bootstrap confidence intervals 219 15.7 Transformations for the ANOVA 220 Exercises 221 Appendix A15 221 A5.1 Variance stabilizing transformation 221 Solutions to exercises 222 Appendix tables 249 References 261 Index 264
Subject Areas: Mathematics [PB]