
Freshly Printed - allow 5 days lead
Couldn't load pickup availability
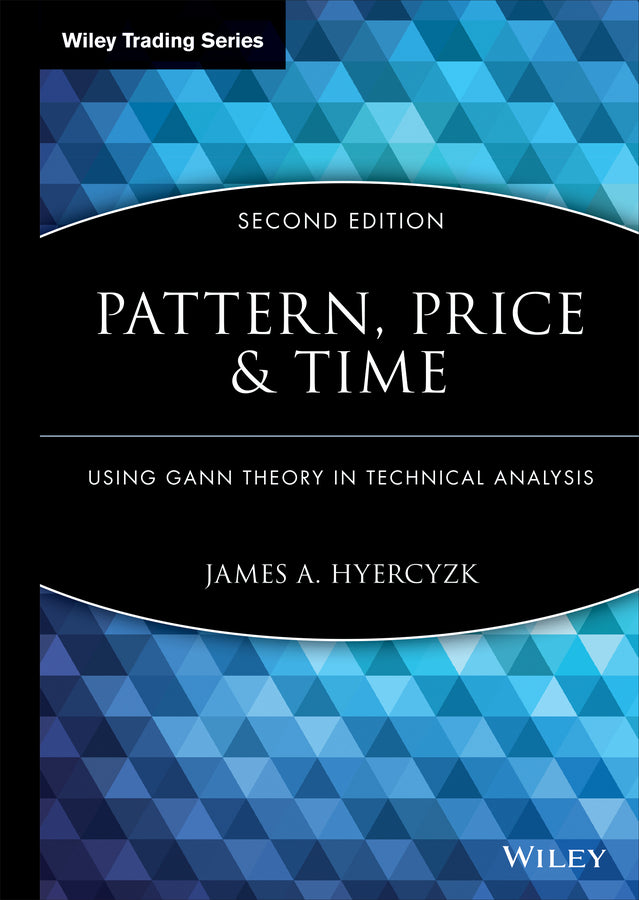
Pattern, Price and Time
Using Gann Theory in Technical Analysis
James A. Hyerczyk (Author)
9780470432020, Wiley
Hardback, published 29 April 2009
288 pages, Screen captures: 203 B&W, 0 Color; Tables: 1 B&W, 0 Color
26 x 18.3 x 2.4 cm, 0.68 kg
An updated look at applying W. D. Gann's controversial trading concepts to all major markets W. D. Gann continues to be one of the most controversial figures in technical analysis. Despite his detractors, his theories remain fundamentally solid, and have been successfully adapted by several generations of traders. In this authoritative text, expert technician James Hyerczyk presents a straightforward overview of Gann Theory, its basic principles, and its proper applications in creating profitable trading systems. Hyerczyk examines, in complete detail, such essentials as swing charts and trend indicators, percentage retracements, Gann angles, and cycle dates. With fresh information about how to use price scales when charting forex, equity, and ETF markets, as well as discussions on how to calculate Gann angles for each market, this Second Edition of Pattern, Price and Time is a must-read for anyone looking to thoroughly understand–and successfully implement–one of the most important and powerful trading methods in existence.
Preface ix Acknowledgments xiii Chapter 1 Why Pattern, Price, and Time? 1 Chapter 2 Who Was W. D. Gann? 5 Chapter 3 Gann Theory in a Nutshell 17 The Basis of Gann Theory: The Law of Vibration 23 Pattern 28 Price 28 Time 30 Squaring the Price Range with Time 32 Advanced Price and Time Techniques 33 Gann Theory and Its Application to Trading 42 Chapter 4 Chart Basics 45 Gann-Format Charts 45 Proper Chart Construction 50 Charting Programs 56 Types of Charts 57 Summary 66 Chapter 5 Pattern: Trend Indicator Charts 69 Minor Trend Indicator 70 Intermediate Trend Indicator 74 Main Trend Indicator 80 Trend Indicator Construction 84 Stop Orders 87 Using the Information Generated 88 Characteristics of the Trend Indicator Chart 89 Summary 90 Chapter 6 Pattern: Swing Chart Trading 91 Reviewing the Trend Indicator Chart Rules 91 Basic Trading Instructions 95 Two Ways to Determine a Change in Trend 99 Other Swing Chart Trading Strategies 102 Swing Trading Rules 104 Swing Chart Negatives 119 Summary 122 Chapter 7 Pattern: Other Chart Formations 125 The Double Bottom 125 The Double Top 127 Prolonged Rally or Break Rule 128 Balancing Swings 129 Signal Tops and Signal Bottoms 133 Other Important Formations 140 Other Popular Patterns 141 Summary 141 Chapter 8 Price: Horizontal Support and Resistance 143 The Swing Charts 143 Percentage Retracement Price Levels 146 Other Retracement Levels 149 Multiples of Bottoms and Divisions of Tops 149 Pivot Price Calculations 150 Moving Averages 153 Summary 154 Chapter 9 Price: Gann Angles 155 Importance of Gann Angles 156 How to Construct Gann Angle Charts 167 Summary 195 Chapter 10 Combining Pattern and Price 197 Chapter 11 Time 203 Natural Cycles 203 Anniversary Dates 210 Seasonality 216 Swing Charts 221 Square Charts 225 Summary 231 Chapter 12 Combining Pattern, Price, and Time 233 The Intermediate Trend Indicator 233 The Signal Bottom 238 The Signal Bottom: The First Leg Up 243 Gann Angles 245 Percentage Retracement Zones 248 Percentage Retracement Zones and Gann Angle Combinations 251 Time Indicators 251 The Forecast 253 Conclusion 255 About the Author 257 Index 259
Subject Areas: Finance & accounting [KF]