
In Stock - same-working day dispatch
Couldn't load pickup availability
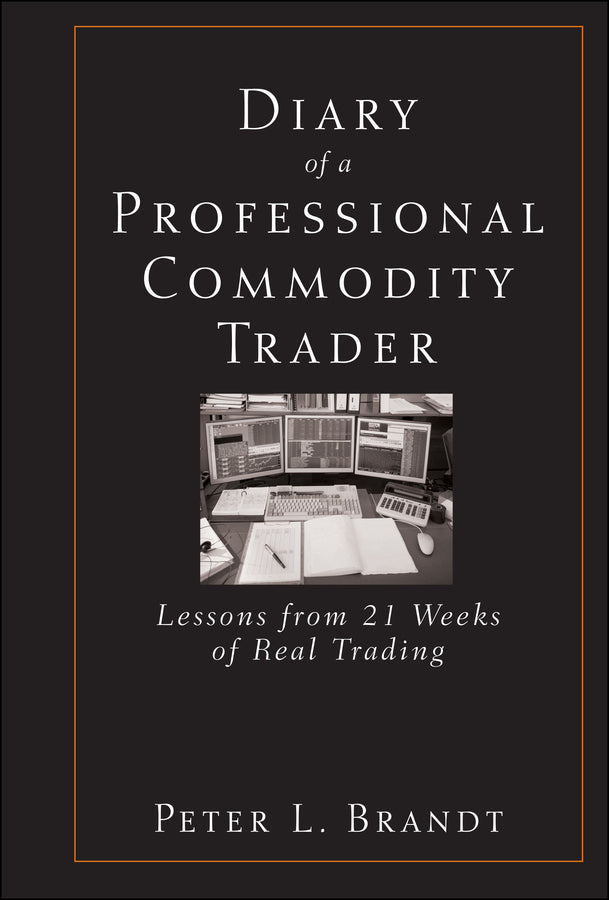
Diary of a Professional Commodity Trader – Lessons from 21 Weeks of Real Trading
Lessons from 21 Weeks of Real Trading
PL Brandt (Author)
9780470521458
Hardback, published 18 February 2011
304 pages, Charts: 223 B&W, 0 Color; Tables: 19 B&W, 0 Color
23.5 x 15.8 x 2 cm, 0.56 kg
Diary of a Professional Commodity Trader: Lessons from 21 Weeks of Real Trading Trading is generally far more difficult in practice than in theory. The reality is that no trade set up or individual trader or system can identify profitable trades in advance with complete certainty. In A Year of Trading, long-time trader Peter Brandt reveals the anxieties and uncertainties of trading in a diary of his 2009 trades. He explains his thought process as he searches for trading opportunities and executes them. Each trade includes charts, an analysis of the trade, and a play-by-play account of how the trade unfolds.
Acknowledgments xiii Part I Foundations of Successful Trading 1 Introduction 3 The Invention of a Commodity Trader 3 Why I Wrote This Book 7 This Book's Audience 9 The Book's Road Map 14 Chapter 1 The History and Theory of Classical Charting Principles 19 My Perspective of the Principles 20 Three Limitations of the Principles 21 Summary 22 Part II Characteristics of a Successful Trading Plan 23 Chapter 2 Building a Trading Plan 25 Trader Personality and Temperament 25 Adequate Capitalization 29 Overall Risk Management 30 Points to Remember 32 Chapter 3 Identifying the Trades and the Trading Vocabulary 33 Trade Identification 35 Vocabulary of the Factor Trading Plan 35 Points to Remember 54 Chapter 4 Ideal Chart Patterns 55 Reversal H&S Pattern in Copper 56 Reversal Rising Wedge in AUD/USD 56 Continuation Wedge and Reversal Failure Top in Soybean Oil 57 Reversal Triangle Bottom in Sugar 58 Continuation and Pyramid Patterns in USD/CAD 58 Reversal Top in Silver 59 Continuation H&S Pattern in the Russell 1000 Index 60 Continuation Rectangle in Kansas City Wheat 61 Continuation Rectangle and Pyramid Triangle in Crude Oil 61 Continuation H&S Top in the Dow Utilities 63 Continuation Triangle, Reversal M Top, and Flag in the EUR/USD 63 H&S Reversal Top and Three Continuation Patterns in the GBP/JPY 65 A Reversal Symmetrical Triangle in the AUD/JPY 66 Two Continuation Patterns in GBP/CHF 67 A Triangle and Running Wedge in Sugar 67 An H&S Bottom in Apple Computer 68 A Major Continuation H&S and Symmetrical Triangle in Gold 68 A Series of Bullish Patterns in Copper 70 A Failed Ascending Triangle in the USD/CAD Crossrate 71 A 12-Week Rectangle in the Dow Jones Transport Index 72 A Rare Horn in Brent Sea Oil 72 An H&S Bottom Launches the 2009 Bull Market in the S&Ps 73 Summary 74 Points to Remember 74 Chapter 5 How the Factor Trading Plan Works 75 Trade Identification 75 Trade Entry 84 Trade Risk Management 85 Trade Order Management 86 Points to Remember 89 Chapter 6 Three Case Studies Using the Factor Trading Plan 91 A Remarkable Technical Event in the Dow Jones 92 A Year Trading Gold 94 A Year Trading Sugar 104 Points to Remember 113 Chapter 7 Characteristics of a Successful Trader 115 Intimate Knowledge of Trading Signals 116 Discipline and Patience 117 Analysis of Self and of the Trading Plan 117 It Takes a Leap of Faith 120 Points to Remember 121 Part III A Five-Month Trading Diary: Let The Journey Begin 123 Chapter 8 Month One: December 2009 127 Trading Record 129 Summary 143 Chapter 9 Month Two: January 2010 145 Identifying Trading Opportunities 146 Amending the Plan 151 Trading Record 152 Summary 170 Chapter 10 Month Three: February 2010 171 Sticking to the Plan in Choppy Markets 171 Trading Record 173 Summary 187 Chapter 11 Month Four: March 2010 189 Trading Record 190 Summary 201 Chapter 12 Month Five: April 2010 203 Relying on Classical Charting Principles 204 Trading Record 205 Outlook for the Future 210 Summary 214 Part IV The Wrap-Up 215 Chapter 13 Analysis of Trading Performance 217 How the Trading Plan Performed 221 How the Plan (and the Trader) Evolved 227 Summary: Best Practices Going Forward 228 Chapter 14 The Best Dressed List 231 A Seven-Month Double Bottom in AUD/USD 231 A 14-Month Coil and Nine-Month Descending Triangle in EUR/CHF 233 A Six-Month Wedge in EUR/USD 234 A 16-Week Horn in GBP/USD 235 A Four-Month H&S in Bottom NZD/USD 236 A Six-Month Ascending Triangle Failure in USD/CAD 237 An Eight-Month H&S Bottom in the S&Ps 238 A 14-Month Symmetrical Triangle in Sugar 239 A Seven-Month Triangle in Gold 240 A Series of Continuation Patterns in Copper 242 An H&S Bottom in Crude Oil 243 Summary 243 Postscript 245 Appendix A Factor Trading Plan Signals 249 Appendix B Quick Reference to Charts 257 Appendix C Recommended Resources 269 Author's Note 271 Index 275
Subject Areas: Finance & accounting [KF]